Why sea level is rising, and why the science is more than a shoreline story
Rising sea level is often described as water creeping up a beach, but the physical story is far more layered. The height of the ocean reflects heat stored in seawater, ice lost from continents, shifts in gravity, slow movements of the land, winds, currents, atmospheric pressure, and the geometry of ocean basins. Scientists do not measure one simple global bathtub. They assemble evidence from tide gauges fixed to coasts, satellites measuring ocean surface height, gravity missions weighing ice loss, ocean floats tracking heat, and models that test how the climate system responds to greenhouse gases. The result is a picture that is both clear and complex: the global ocean is rising because it is gaining heat and mass, while local sea level depends on where that water goes, how land is moving, and how the ocean circulates.
A: Heating increases the average motion of water molecules, which lowers density and expands the volume of a water mass.
A: No. Floating sea ice has little direct effect on sea level. Land ice matters because it transfers water from land to ocean.
A: Satellites provide broad ocean coverage, while tide gauges provide long coastal records where people actually experience flooding.
A: It is sea level change caused by changes in seawater density, mainly from warming and sometimes from salinity shifts.
A: It is sea level change caused by adding or removing water mass from the ocean, especially from melting glaciers and ice sheets.
A: Regional sea level depends on currents, winds, gravity, land motion, ocean density, and where ice is being lost.
A: Large ice sheets attract nearby ocean water. When they lose mass, that attraction weakens and water redistributes around the planet.
A: Uncertainty clarifies the range of plausible outcomes and helps planners prepare for both central estimates and higher-risk possibilities.
A: Yes. Oceans and ice sheets respond slowly, so committed rise can continue long after surface temperature stabilizes.
A: Ice sheets involve ocean melt, bedrock shape, fractures, grounding-line movement, snowfall, and feedbacks that can change rapidly.
The ocean as a heat reservoir
The first major piece of sea level science is ocean heat content. Earth is absorbing more energy than it emits back to space, mainly because greenhouse gases reduce the efficiency with which heat escapes. The atmosphere warms, but the ocean takes up the overwhelming share of the excess energy. Water has a high heat capacity, so it can store vast amounts of heat with smaller temperature changes than air. This storage is not passive. Heat enters through the surface, is mixed downward by winds and turbulence, and is transported by currents into the interior ocean.
As seawater warms, it expands. Scientists call this steric sea level change, and it can raise sea level even if the total mass of ocean water stays the same. The effect varies by region because heat is not distributed evenly. Western boundary currents, subtropical gyres, polar waters, and deep basins all take up heat in different ways. A few tenths of a degree in a thick layer of ocean can translate into measurable sea level rise because the ocean is so deep and so broad.
Density, salinity, and steric change
Steric change is not only about temperature. Salinity also affects density. Saltier water is denser, while fresher water is lighter. When rainfall, evaporation, river flow, or ice melt changes the salt content of a water mass, sea level can shift locally because the same mass of water occupies a different volume. In practice, temperature usually dominates global steric rise, but salinity helps explain regional patterns and vertical structure.
This is why oceanographers measure both temperature and salinity. A warm, salty layer may have a different density effect than a warm, fresh layer. The vertical profile matters as much as the surface condition, because expansion at depth contributes to sea surface height above it. Modern observing systems, especially profiling floats, have made it possible to track these changes through much of the upper ocean and into deeper layers with increasing detail.
Steric sea level rise also has inertia. Heat that reaches the deeper ocean does not vanish when a cool year occurs at the surface. It can remain stored for decades or centuries, slowly reshaping the height of the sea. This is one reason sea level rise is expected to continue even under strong emissions reductions. Stopping the temperature climb limits future damage, but the ocean does not instantly forget the heat it has already absorbed.
Adding water from land ice
The second major driver is mass addition. When mountain glaciers, the Greenland Ice Sheet, or the Antarctic Ice Sheet lose ice to the ocean, global mean sea level rises because water that had been stored on land joins the ocean. This is different from melting floating sea ice, which is already displacing seawater. Land ice is the central concern because it represents water held above sea level, sometimes in enormous frozen reservoirs. Mountain glaciers respond relatively quickly to warming and have contributed strongly to recent rise, while the great ice sheets contain enough ice to shape sea level over centuries and millennia.
Why ice sheets are not simple blocks of ice
Ice sheets behave like slow-moving systems, not static piles. Snow accumulates inland, compresses into ice, and flows outward under its own weight. Ice is lost through surface melting, runoff, iceberg calving, and melting where floating ice shelves contact warmer ocean water. The balance among these processes determines whether an ice sheet gains or loses mass. A warmer atmosphere can increase snowfall in some places, but warming also increases melt and can speed up ice flow toward the sea.
Antarctica adds special complexity because much of its vulnerable ice rests on bedrock below sea level. Where ice flows into the ocean, it can form floating shelves that buttress the ice behind them. If warm water thins those shelves from below, grounded ice can accelerate. The grounding line, where ice leaves the bed and begins to float, is a critical boundary. If it retreats into deeper basins, some sectors can become harder to stabilize. These dynamics are among the largest sources of uncertainty in long-term projections.
Gravity, rotation, and sea level fingerprints
A common misunderstanding is that meltwater spreads evenly across the ocean. In reality, large ice masses affect sea level through gravity. Greenland and Antarctica are so massive that they pull nearby ocean water toward them. When an ice sheet loses mass, its gravitational pull weakens, and nearby sea level can actually rise less than the global average or even fall in the immediate region, while areas farther away can rise more.
Ice loss also changes how mass is distributed on Earth. That can slightly alter the planet's rotation and the position of the ocean relative to the solid Earth. These effects create regional patterns called sea level fingerprints. A fingerprint from Greenland loss differs from one caused by West Antarctic loss, and both differ from mountain glacier melt. Scientists use these patterns to connect observed regional changes with likely sources of added water.
The solid Earth responds too. When ice is removed, the crust can rebound upward near former ice loads. Elsewhere, the mantle adjusts and land may subside. This process, called glacial isostatic adjustment, is still unfolding from the last ice age. It matters because sea level is measured relative to land in many coastal records. A stable ocean next to sinking land can look like rising sea level, while a rising coast can mask part of the ocean signal.
These geophysical details are not academic decoration. They help explain why one coast experiences a different trend than another and why global averages cannot be directly pasted onto local planning maps. Sea level science is partly oceanography, partly cryosphere physics, and partly geodesy, the science of measuring Earth's shape, gravity field, and motion.
How tide gauges record relative sea level
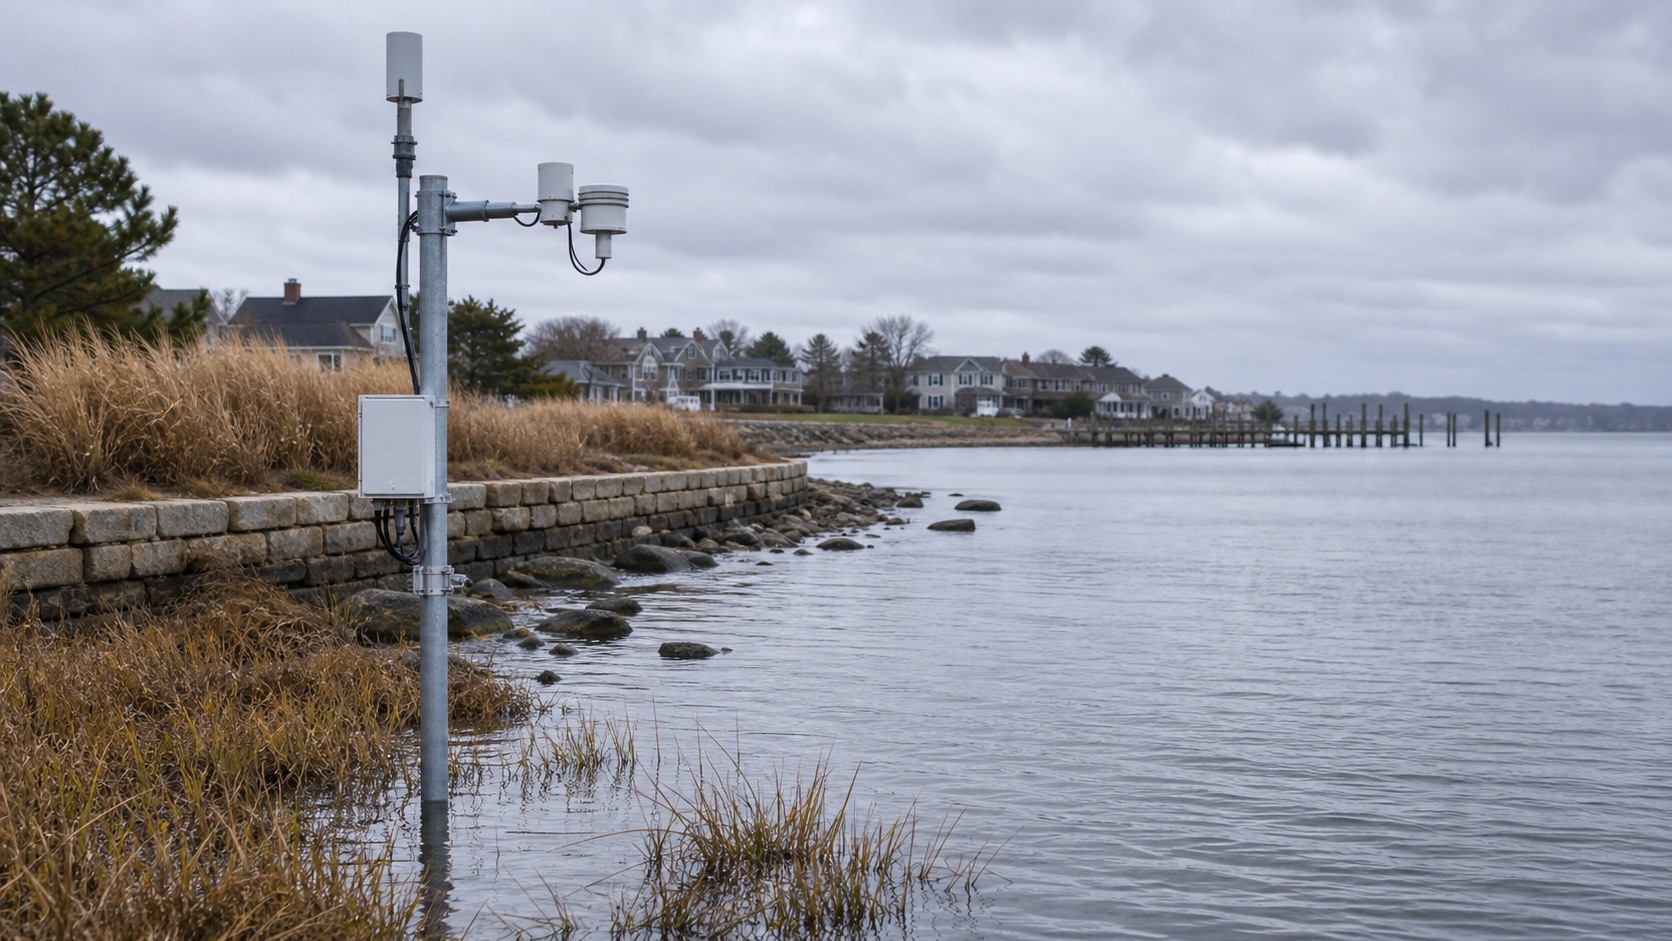
Tide gauges are among the oldest tools in sea level science. They measure the height of the sea relative to a fixed point on land, often in harbors or along engineered coasts. Long gauge records are invaluable because they show how local water levels have changed over many decades. They also capture the reality that matters for streets, seawalls, drains, wetlands, and buildings: the water level relative to the land people stand on.
The limitation is that a tide gauge cannot, by itself, separate ocean rise from land movement. If the land is sinking because of groundwater withdrawal, sediment compaction, tectonics, or post-glacial adjustment, the gauge records faster relative rise. If the land is rising, the gauge records slower relative rise. Scientists pair tide gauges with GPS and other geodetic measurements to estimate vertical land motion. This pairing turns a local shoreline record into a more physically interpretable signal.
Satellite altimetry and the open ocean view
Satellite altimeters changed sea level science by measuring sea surface height across most of the ice-free ocean. These instruments send radar pulses toward the ocean and measure the return time, while precise orbit tracking tells scientists where the satellite is in space. After correcting for tides, atmospheric effects, waves, and instrument factors, researchers can estimate how the sea surface is changing over large areas.
Altimetry provides a global perspective that tide gauges cannot. It reveals basin-scale patterns, such as where sea level is rising faster because currents shift or heat accumulates. It also helps measure global mean sea level since the early 1990s with consistent ocean coverage. The record is shorter than many tide gauge records, but it is spatially rich and central to modern assessments.
Satellites do not eliminate uncertainty. Coastal zones are harder to measure from space because land can contaminate the radar signal, and different satellite missions must be carefully stitched into one stable record. Still, when altimetry agrees with independent estimates from ocean heat expansion and land ice mass loss, confidence grows. The strength of sea level science comes from convergence among different instruments.
Weighing ice and water with geodesy
Geodesy gives scientists tools for measuring mass movement directly. Gravity satellite missions detect tiny changes in Earth's gravity field caused by mass shifting from one place to another. When Greenland loses ice, when Antarctica sheds mass, or when water storage changes on land, the gravity field changes. These observations help estimate how much mass is being added to the ocean and how that contribution evolves over time.
Other geodetic tools include GPS stations, laser ranging, and reference frame systems that define positions on a moving planet. A sea level number is only meaningful if scientists know whether the land, satellite, and ocean surface are being measured in a consistent frame. This is delicate work, but it is essential. Millimeters per year are small compared with waves and tides, so the observing system must be stable, calibrated, and cross-checked.
Separating trend from natural variability
Sea level does not rise as a perfectly smooth line. Winds can push water toward or away from a coastline. El Nino and La Nina can redistribute water across the Pacific. Atmospheric pressure changes can depress or lift the sea surface. Seasonal heating and freshwater input create annual cycles. Storm surge can briefly raise water far above the background level. These variations can be large over days, months, or a few years.
To identify the climate-driven trend, scientists analyze long records and remove known periodic signals where appropriate. They compare tide gauges with nearby land motion, satellite altimetry with ocean measurements, and regional patterns with climate modes. This does not mean short-term events are unimportant. In fact, a higher mean sea level makes extreme water levels more frequent because storms and high tides start from a raised baseline.
The difference between mean sea level and extremes is crucial for risk. A few inches of background rise can turn a rare nuisance flood into a regular disruption if local topography is flat and drainage is poor. The physics of the mean trend and the physics of storms are different, but they combine at the shoreline. That combination is why sea level science matters even before dramatic permanent inundation occurs.
Models, scenarios, and uncertainty
Sea level projections use models that represent the ocean, atmosphere, glaciers, ice sheets, land water storage, and Earth deformation. Some components are better constrained than others. Thermal expansion can be linked to ocean heat uptake in climate models. Glacier response can be estimated from temperature, precipitation, and glacier geometry. Ice sheets are more challenging because their behavior depends on processes such as cliff failure, basal sliding, ocean-driven melt, and grounding-line retreat.
Scenarios are not forecasts in the everyday sense. They are structured assumptions about future emissions, warming, and societal choices. A low-emissions pathway produces a different sea level future than a high-emissions pathway, especially after mid-century and beyond. Near-term rise is partly locked in by past heat uptake, but long-term outcomes depend strongly on how much warming the world ultimately allows.
Uncertainty is not ignorance. It is a map of what is known, what is bounded, and what remains difficult. Scientists often present likely ranges, but coastal planners may also examine low-probability, high-impact outcomes because infrastructure lasts a long time. A wastewater plant, bridge approach, port, or neighborhood cannot be evaluated only against the central estimate if failure would be severe.
The clearest conclusion is that rising seas are a physics problem with a policy clock. Heat expands the ocean. Land ice adds water. Gravity and land motion shape the regional pattern. Measurements from coasts, satellites, floats, and gravity missions agree on the broad direction of change. The remaining question is not whether the ocean is rising, but how much rise society chooses to limit, and how intelligently communities prepare for the rise already underway.